-
Overview
-
Q & A
-
Practical sheets
-
-
- Aucun article
-
-
- Aucun article
-
-
-
- Backup : Agent-Level B&R via NSS for IAAS offer
- Backup : Create VCOD Backup
- Backup : Netbackup Agent Installation for Linux
- Backup : Netbackup Agent Installation for Windows
- Backup : Overall Design for VCOD Offer
- Backup : User's Guide for VCOD Offer
- NSX-T : Configuring a Distributed Firewall
- NSX-T : Create VPN Ipsec
- NSX-T : Creation of T1
- NSX-T : DNAT configuration
- NSX-T : How to configure a Gateway Firewall
- NSX-T : SNAT configuration
- NSX-T: Create and Configure a Geneve Overlay Segment
- NSX-T: How to configure an IPSEC solution
- vCenter : Clone a VM
- VCenter : Create a new VM
- VCenter : Create a snapshot of a VM
- VCenter : Reset cloudadmin password
- VCenter : Storage Vmotion on a VM
- VCenter : Upgrade Vmware tools on a VM
-
-
Services
-
-
- Aucun article
-
- Aucun article
-
- Aucun article
-
- Aucun article
-
- Aucun article
-
- Aucun article
-
- Aucun article
-
-
-
- Aucun article
-
- Aucun article
-
- Aucun article
-
-
- Aucun article
-
- Aucun article
-
-
Discover vROPS Tenant
Overview
vROPS Tenant is a tool integrated into the vCloud Director portal, allowing each organization administrator to access low-level metrics of their infrastructure.
Access to the portal
From the vCloud Director portal, in the top menu bar, select the Operations Manager option.
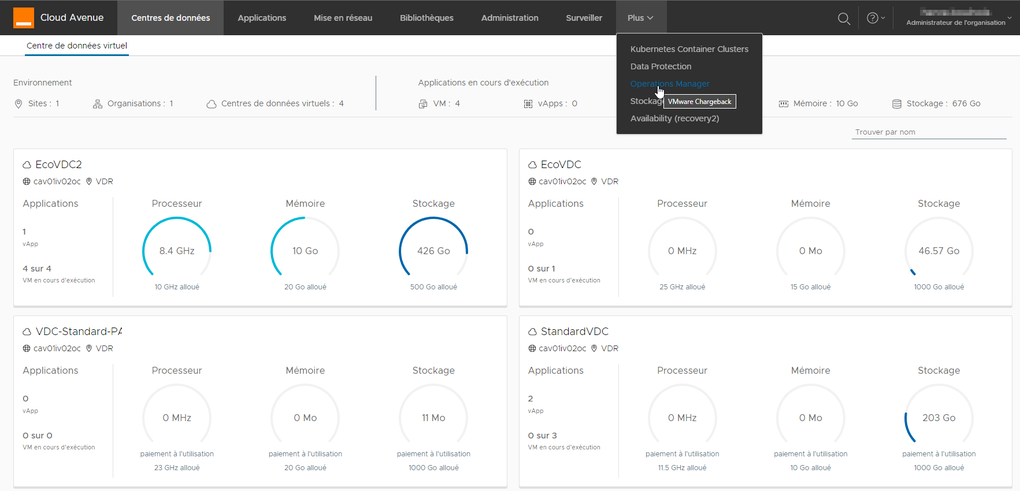
A new portal appears, with its own left menu. Note that it is only in English.
Returning to the vCloud Director portal is done by clicking on the options in the top menu of the page.
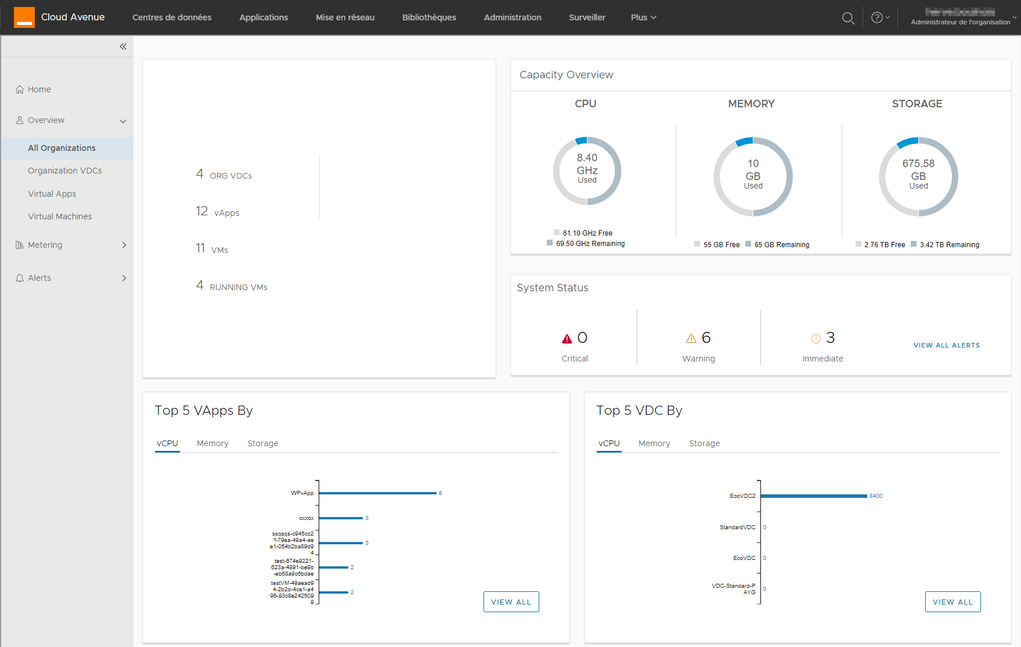
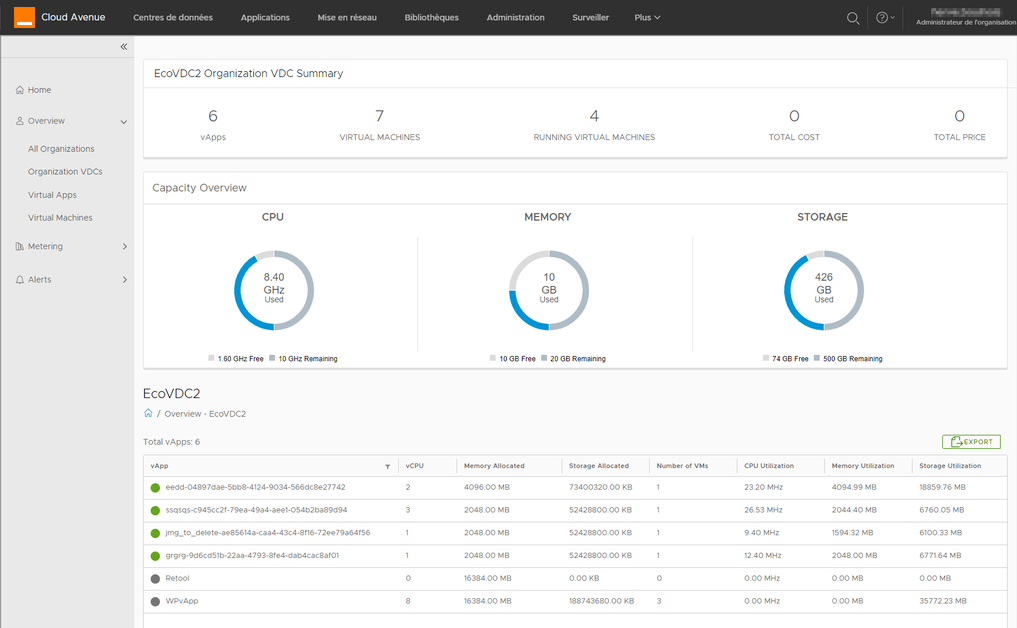
By clicking on Overview, a summary of the resources deployed in the organization is displayed.
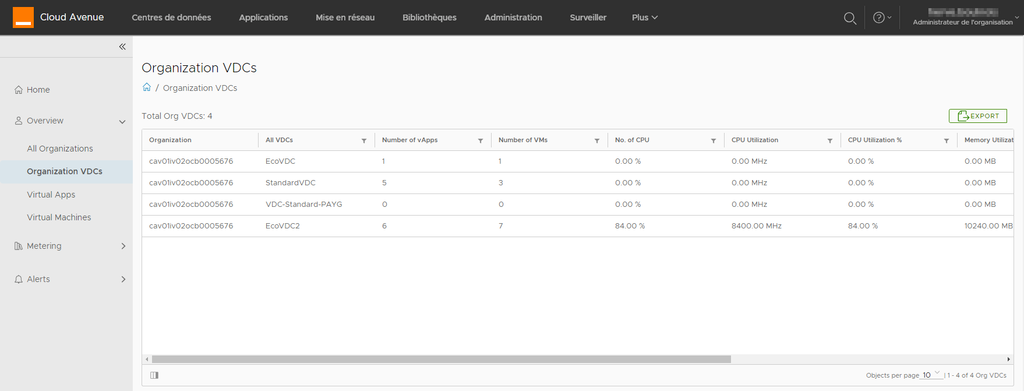
It is also possible to list the vDCs present in the organization.
Note the presence of an EXPORT button, which is often found above a data table, allowing you to retrieve the displayed data into an Excel file.
Clicking on a vDC listed in the table will bring up the following page.
This page displays a summary of the vDC (allocated and consumed resources, list of vApps).
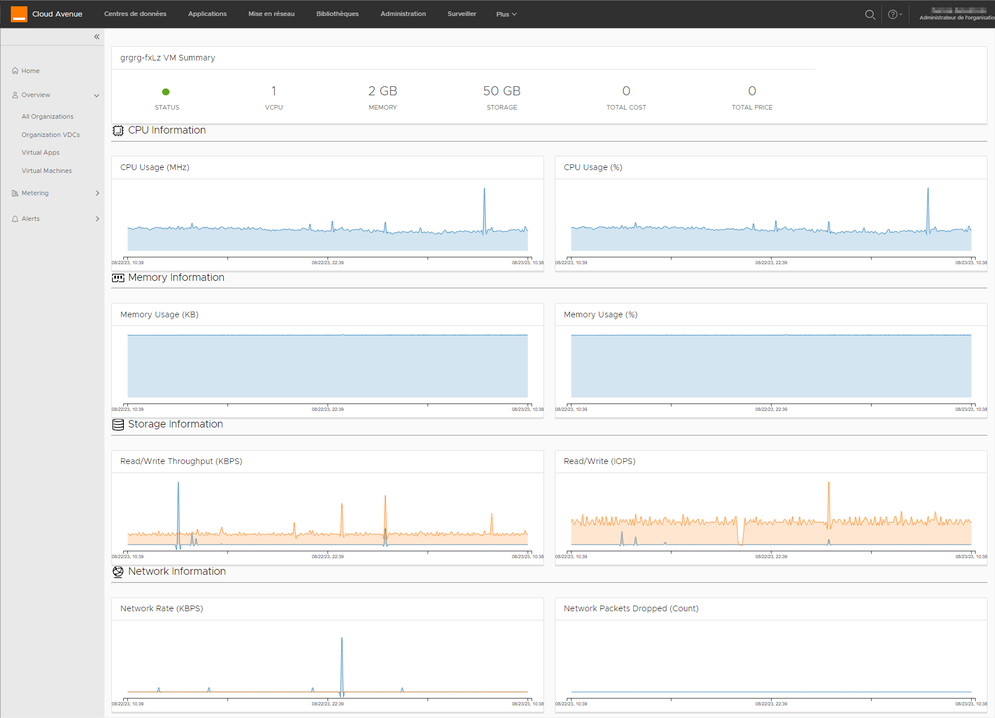
In the previous list, clicking on a vApp will display a dashboard with VMware metrics.
Note that the status displayed at the top is green here, but it can turn red if VMware detects issues affecting the proper functioning of the VM or vApp (lack of resources, for example, or over-provisioning of resources relative to actual usage).
The Metering menu provides access to a whole list of low-level metrics for troubleshooting a VM that might be malfunctioning.