Step 7 – Configuring the monitoring (CES)
In this step, you will use a Cloud Eye Service (CES) to see how the ECS, AS, and ELB services respond to overloading the created infrastructure. CES is a service that oversees resources on the Flexible Engine. It provides several alarms, reporting modes and sends notifications quickly, so you can ensure that the services are working.
In this step, you will have access to monitoring to explore the monitoring dashboard, create new monitoring panels and create alerts that send you notifications.
7.1. View metrics by object
To access CES, choose the Cloud Eye service from the console.
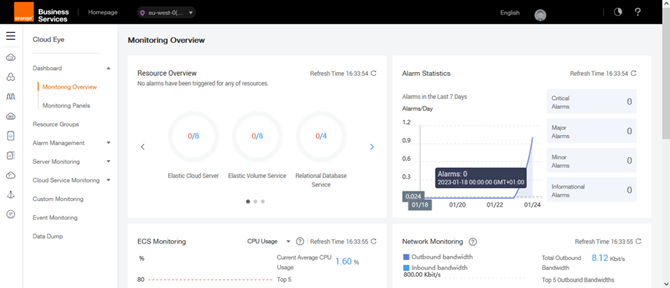
The Dashboard displays the number of metrics available for the services deployed on your infrastructure. For each type of object deployed (in our case: AS, ECS, ELB, EVS, RDS and VPC), several metrics are available by default.
For example, to see the metrics linked to our ELB, click Cloud Service Monitoring then on ELB. You can choose to display metrics on a predefined time window, from 1H (Last 1 hour) to last 30 days, or select the time interval (Select Time Range) precisely.
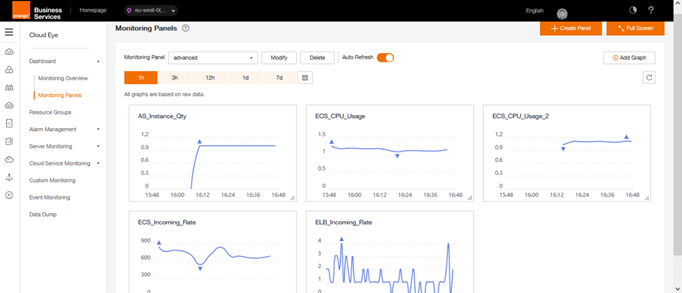
7.2. Creating a custom view
To create a new view of the monitoring panel, return to the Dashboard>Monitoring Panel and click Create, and give it the name: advanced.
Click on Add Graph that appears at the right of the page to add a metric of monitoring.
Fill in the following information :
- Title: AS_Instance_Qty
- Monitoring Metric:
- Ressource type: Auto Scaling
- Dimension: AS Group
- Monitored Object: Select as-group-advanced
- Metric: Number of Instances
Do the same for CPU usage of ECS ecs-web :
- Title: ECS_CPU_Usage
- Monitoring Metric:
- Ressource type: Elastic Cloud Server
- Dimension: ECSs
- Monitored Object: Select: ecs-web
- Metric: CPU Usage
- Title: ECS_CPU_Usage_2
- Monitoring Metric:
- Ressource type: Elastic Cloud Server
- Dimension: ECS
- Monitored Object: Select: The ECS created by the AS service
- Metric: CPU Usage
Do the same for packets entering the ECS ecs-web:
- Title: ECS_Incoming_Rate
- Monitoring Metric:
- Ressource type: Elastic Cloud Server
- Dimension: ECS
- Monitored Object: Select: ecs-web
- Metric: Outband Incoming Rate
Do the same for packets entering the ELB:
- Title: ELB_Incoming_Rate
- Monitoring Metric:
- Ressource type: Elastic Load Balancer
- Dimension: Elastic Load Balance
- Monitored Object: Select: elb-advanced
- Metric: Incoming Packets
At the end, you get a metric table equivalent to the one shown below:
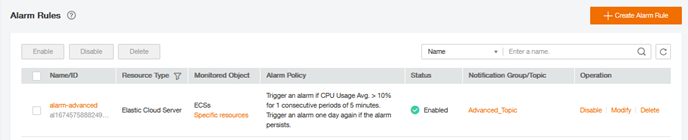
7.3. Creating an alarm with notification
We will now create an alarm to be notified when a metric is exceeded. We will take the case of a CPU value higher than 10% for an ECS.
Click Alarm Management, then click the Create Alarm Rule button, and enter the following information
- Name: alarm-advanced
- Description: Alarm related to CPU use of an ECS
- Ressource type: Choose Elastic Cloud Server
- Dimension: ECS
- Monitoring Scope: Specific ressources, select Ecs–web
- Method: Create manually
- Metric Name: CPU Usage
- Occurrences: 1
- Monitoring Interval: 5 minutes
- Threshold: > 10%
- Alarm Notification: Yes
- Notification Object: select the Topic SMN created in step 8
- Trigger Condition: General alarm, Cleared alarm,
Click the button OK.